
Cacti - Graph 16 CPUs for one Windows machine
We have some nice new machines at work, Dell R610 boxes with dual quad-core CPUs. These CPUs also have hyperthreading, so the OS sees 16 cores. We’re running Windows Server 2008 on them.
Cacti’s normal Windows graphing doesn’t include an “all CPU usage” graph, just per-CPU graphs. This is fine for a couple of CPUs, or even four CPUs, but when you get up into 16 it’s just annoying. Nobody wants 16 graphs to get an overview of CPU usage.
I did some Google searches and found some useful bits towards the bottom of this howto about Cacti on Ubuntu. Unfortunately adding more CPUs to their existing 8 CPU template didn’t work well, so I just used created my own with theirs as a guideline. In the spirit of open source, I’m making the graph template available here. Let me know if it’s useful.
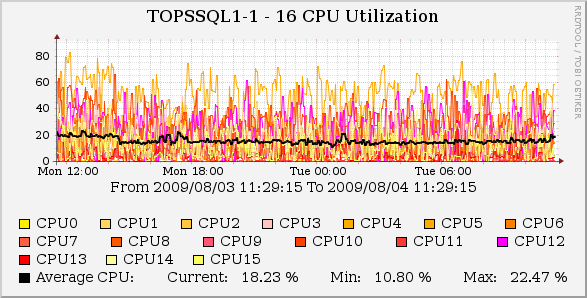
Sample graph:
Template file:
cacti_graph_template_host_mib_-_multi_cpu_utilization_on_16_processor_box_new.xml
How to use:
- Import the graph template (requires Cacti 0.8.7b or newer)
- Go to the device you want to graph, click “Create Graphs for this Host”, choose the 16 CPU graph, and click Create. On the next page prompting for input just click Create again, not entirely sure why it shows that.
- Go into the “Graph Management” screen, find the graph you just created, and select it.
- In the “Supplemental Graph Template Data” section, for each data source field select the corresponding data source from your device (this step is annoying, but I haven’t found a way around it - let me know if you find one), then click Save
- Enjoy your graph!