
OpenNMS and WMI - Part 2, adding more monitors
In the last post about OpenNMS and WMI I covered how to get the WMI monitors included with OpenNMS up and running. Now I’ll cover adding new monitors.
I’ll provide an example that I setup to pull HTTP request data from the W3SVC counters and graph it. Step by step, here we go.
First step is to figure out which WMI objects you want to monitor. I’m mostly interested in performance counters, because that’s my primary need for WMI, but you could also just monitor the value of any WMI object. As I posted recently, Powershell can be a great tool for digging into WMI and finding the class names and available values.
Second, if whatever monitor you’re collecting has multiple entries per server, you’ll need to setup a resourceType entry in datacollection-config.xml. This basically creates a hierarchy for the data you’re collecting that can be retreived when graphing, I’ll discuss more about this below. Here’s my example config chunk. Note that the resourceLabel is populated from the data you collect.
<!-- Resource Type for WMI Web Requests -->
     <resourceType name="wmiW3" label="Windows Web Requests"
                  resourceLabel="${wmiW3Name}">
       <persistenceSelectorStrategy class="org.opennms.netmgt.collectd.PersistAllSelectorStrategy"/>
       <storageStrategy class="org.opennms.netmgt.dao.support.IndexStorageStrategy"/>
     </resourceType>
Third, add the counters you want to collect to the wmi-datacollection-config.xml file. My example:
<!-- A collection of HTTP statistics -->
            <wpm name="win32_w3svc" wmiClass="Win32_PerfFormattedData_W3SVC_WebService" keyvalue="Name"
                 recheckInterval="3600000" ifType="all" resourceType="wmiW3">
                <-- Label for this Web instance -->
                                <attrib name="WebSvcName" alias="wmiW3Name" wmiObject="Name" type="string"/>
                <!-- GET requests per second. -->
                <attrib name="GetRequests" alias="wmiW3GetReq" wmiObject="TotalGetRequests" type="Counter" />
                <!-- HEAD requests per second. -->
                <attrib name="HeadRequests" alias="wmiW3HeadReq" wmiObject="TotalHeadRequests" type="Counter" />
                <!-- POST requests per second. -->
                <attrib name="PostRequests" alias="wmiW3PostReq" wmiObject="TotalPostRequests" type="Counter" />
                <!-- PUT requests per second. -->
                <attrib name="PutRequests" alias="wmiW3PutReq" wmiObject="TotalPutRequests" type="Counter" />
            </wpm>
Once your config is loaded in, this will create a directory structure under the rrd/snmp/[node] directory that looks like rrd/snmp/[nodeID]/wmiW3/[sitename]/[individual counter jrb files]. Make sure that the jrb files are being created – if not, check the logs, particularly daemon/collectd.log.
Fourth, add your graph config to snmp-graph.properties – I know for sure that this file is reloaded as needed by the web interface whenever graphs are requested. The main config chunk is something like the one below, I just copied an existing graph of the type I liked. Once this chunk is in, add the name of your graph to the very long reports= line at the top of the file.
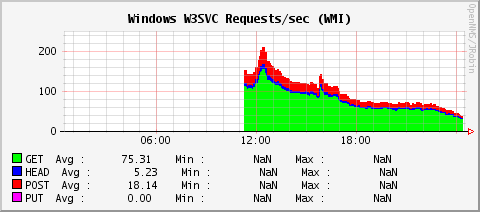
report.wmi.w3.requests.name=Windows W3SVC Requests/sec (WMI)
report.wmi.w3.requests.columns=wmiW3GetReq,wmiW3HeadReq,wmiW3PostReq,wmiW3PutReq
report.wmi.w3.requests.propertiesValues=wmiW3Name
report.wmi.w3.requests.type=wmiW3
report.wmi.w3.requests.command=--title="Windows W3SVC Requests/sec (WMI)" \
 --lower-limit 0 \
 DEF:Get={rrd1}:wmiW3GetReq:AVERAGE \
 DEF:minGet={rrd1}:wmiW3GetReq:MIN \
 DEF:maxGet={rrd1}:wmiW3GetReq:MAX \
 DEF:Head={rrd2}:wmiW3HeadReq:AVERAGE \
 DEF:minHead={rrd2}:wmiW3HeadReq:MIN \
 DEF:maxHead={rrd2}:wmiW3HeadReq:MAX \
 DEF:Post={rrd3}:wmiW3PostReq:AVERAGE \
 DEF:minPost={rrd3}:wmiW3PostReq:MIN \
 DEF:maxPost={rrd3}:wmiW3PostReq:MAX \
 DEF:Put={rrd4}:wmiW3PutReq:AVERAGE \
 DEF:minPut={rrd4}:wmiW3PutReq:MIN \
 DEF:maxPut={rrd4}:wmiW3PutReq:MAX \
 AREA:Get#00ff00:"GET" \
 GPRINT:Get:AVERAGE:"Avg \\: %10.2lf %s" \
 GPRINT:minGet:MIN:"Min \\: %10.2lf %s" \
 GPRINT:maxGet:MAX:"Max \\: %10.2lf %s\\n" \
 STACK:Head#0000ff:"HEAD" \
 GPRINT:Head:AVERAGE:"Avg \\: %10.2lf %s" \
 GPRINT:minHead:MIN:"Min \\: %10.2lf %s" \
 GPRINT:maxHead:MAX:"Max \\: %10.2lf %s\\n" \
 STACK:Post#ff0000:"POST" \
 GPRINT:Post:AVERAGE:"Avg \\: %10.2lf %s" \
 GPRINT:minPost:MIN:"Min \\: %10.2lf %s" \
 GPRINT:maxPost:MAX:"Max \\: %10.2lf %s\\n" \
 STACK:Put#ff00ff:"PUT" \
 GPRINT:Put:AVERAGE:"Avg \\: %10.2lf %s" \
 GPRINT:minPut:MIN:"Min \\: %10.2lf %s" \
 GPRINT:maxPut:MAX:"Max \\: %10.2lf %s\\n"
Fifth and finally, make sure your graphs are working properly. You should see something like this. If they don’t show up, check the webapp/jetty.log log file for errors.
And that should be it! If you have any issues, check the logs, the answer is almost always there.